Introduction to Retina
What is Retina?
Retina is a cloud-agnostic, open-source Kubernetes Network Observability platform which helps with DevOps, SecOps and compliance use cases. It provides a centralized hub for monitoring application and network health and security, catering to Cluster Network Administrators, Cluster Security Administrators and DevOps Engineers.
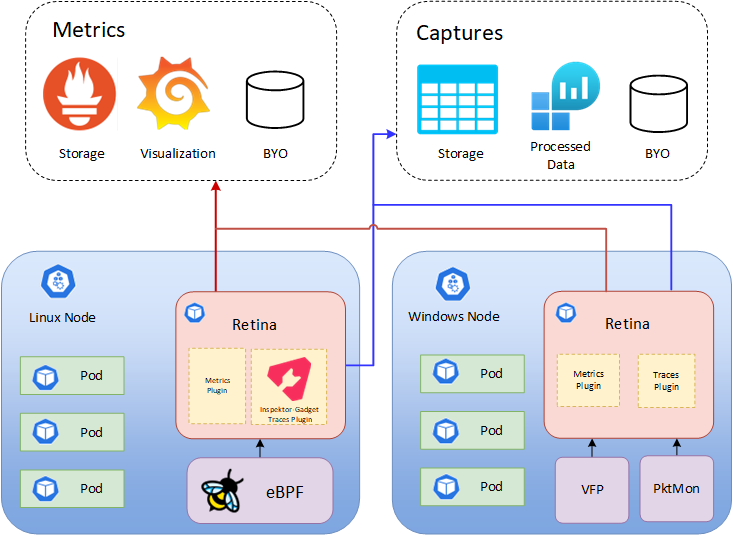
Retina collects customizable telemetry, which can be exported to multiple storage options (such as Prometheus, Azure Monitor, and other vendors) and visualized in a variety of ways (like Grafana, Azure Log Analytics, and other vendors).
Features
- eBPF-based Network Observability platform for Kubernetes workloads.
- On-Demand and Configurable.
- Actionable, industry-standard Prometheus metrics.
- Streamlined Packet Captures for deep dives.
- Cloud-agnostic, supporting multiple OS (like Linux, Windows, Azure Linux).
Why Retina?
Retina lets you investigate network issues on-demand and continuously monitor your clusters. Here are a couple scenarios where Retina shines, minimizing pain points and investigation time.
Investigations: Debugging Network Connectivity
Why can't my Pods connect to each other any more? Typical investigation is time-intensive and involves performing packet captures, where one must identify the Nodes involved, gain access to each Node, run tcpdump commands, and export the results off of each Node.
With Retina, you can automate this process with a single CLI command or CRD/YAML that can:
- Run captures on all Nodes hosting the Pods of interest.
- Upload each Node's results to a storage blob.
To begin using the CLI, see Quick Start Installation.
Monitoring Network Health
Retina supports actionable insights through Prometheus alerting, Grafana dashboards, and more. For instance, you can:
- Monitor dropped traffic in a namespace.
- Alert on a spike in production DNS errors.
- Watch changes in API Server latency while testing your application's scale.
- Notify your Security team if a Pod starts sending too much traffic.
Telemetry
Retina uses two types of telemetry: metrics and captures.
Metrics
Retina metrics provide continuous observability into:
- Incoming/outcoming traffic
- Dropped packets
- TCP/UDP
- DNS
- API Server latency
- Node/interface statistics
Retina provides both:
- Basic metrics (default, Node-Level metrics) and
- Advanced/Pod-Level metrics (if enabled).
For more info and a list of metrics, see Metrics.
Captures
A Retina capture logs network traffic and metadata for the specified Nodes/Pods.
Captures are on-demand and can be output to multiple destinations. For more info, see Captures.
Extendable Architecture
Retina supports several options for storage and insights/visualization. Below is the high-level architecture for Retina, conveying some of these options.

Minimum System Requirements
The following are known system requirements for installing Retina:
- Minimum Linux Kernel Version: v5.4.0