Configuring Grafana
Pre-Requisites
Make sure that you're still port-forwarding your server to localhost:9090, or configure your server for some other HTTP endpoint.
Port-forward svc/prometheus-grafana to access from local browser.
Configuration
-
Check Grafana to make sure the managed Prometheus datasource exists:
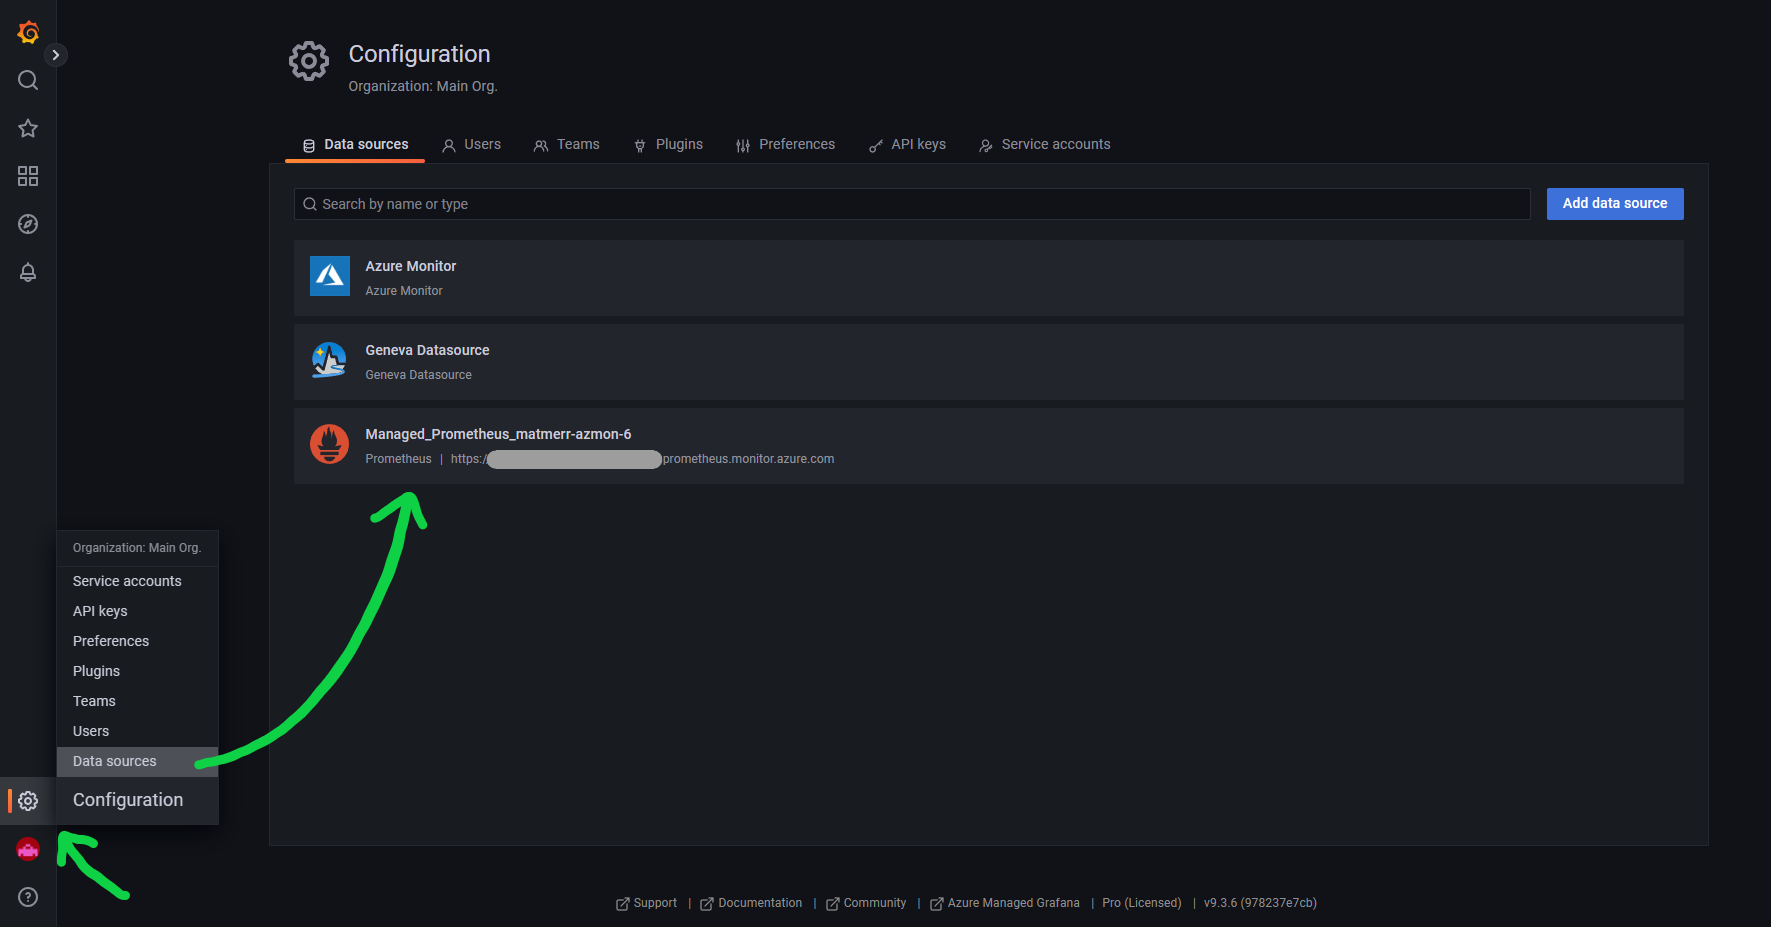
-
Go to the dashboard page and select "import":
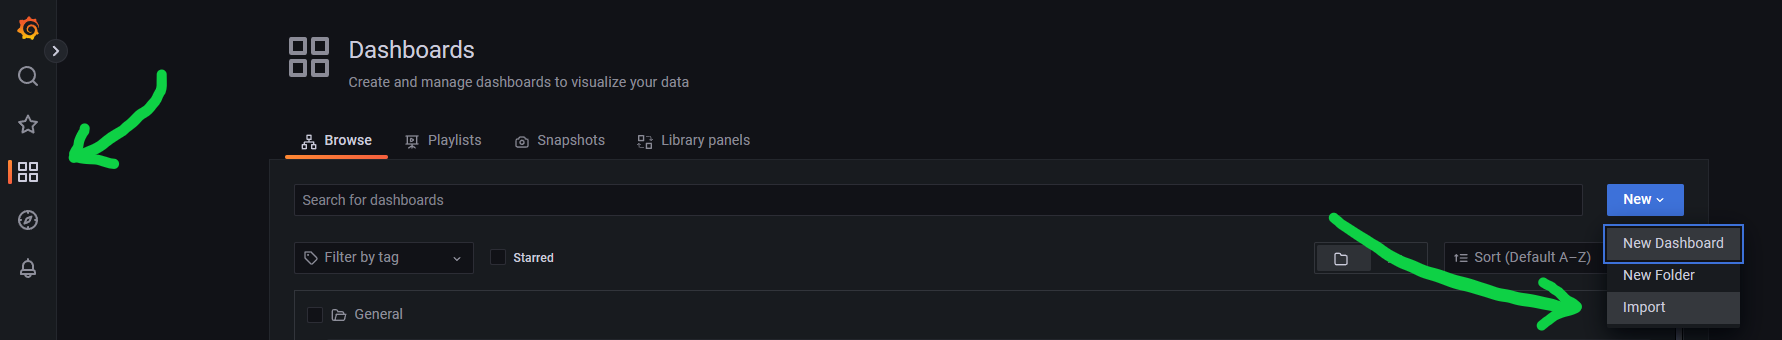
-
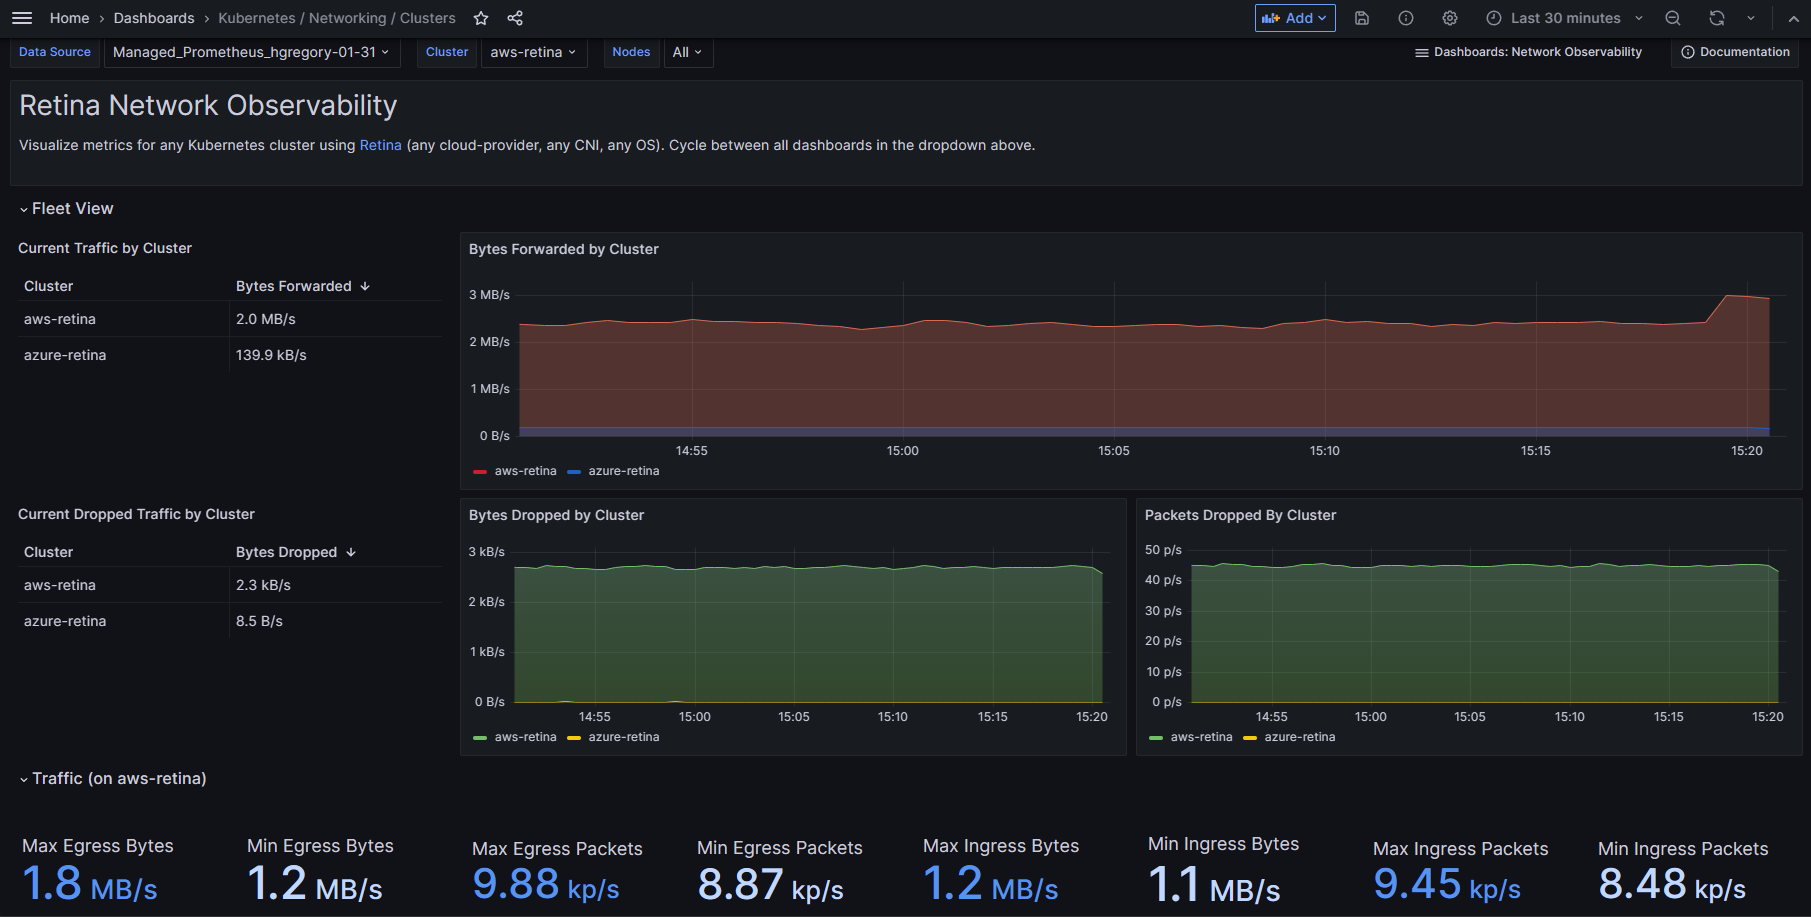
Import the published dashboards by ID 18814
-
The Grafana dashboard should now be visible.
Pre-Installed Dashboards
ID: 18814
If you're using above, versions of these dashbaords are pre-installed under:
- Dashboards > Managed Prometheus > Kubernetes / Networking / Clusters
- Dashboards > Managed Prometheus > Kubernetes / Networking / DNS