Unmanaged Prometheus/Grafana
Pre-Requisites
- Create a Kubernetes cluster.
- Install Retina DaemonSet (see Quick Installation).
Configuring Prometheus
- In this example, we will install Prometheus via the community supported helm chart. If you already have this chart deployed, skip to step 3.
helm repo add prometheus-community https://prometheus-community.github.io/helm-charts
helm repo update
-
Save these Prometheus values below to
deploy/prometheus/values.yaml -
Install the Prometheus chart
helm install prometheus -n kube-system -f deploy/prometheus/values.yaml prometheus-community/kube-prometheus-stack
Or if you already have the chart installed, upgrade how you see fit, providing the new job name as an additional scrape config, ex:
helm upgrade prometheus -n kube-system -f deploy/prometheus/values.yaml prometheus-community/kube-prometheus-stack
Note: Grafana and kube-state metrics may schedule on Windows nodes, the current chart doesn't have node affinity for those components. Some manual intervention may be required.
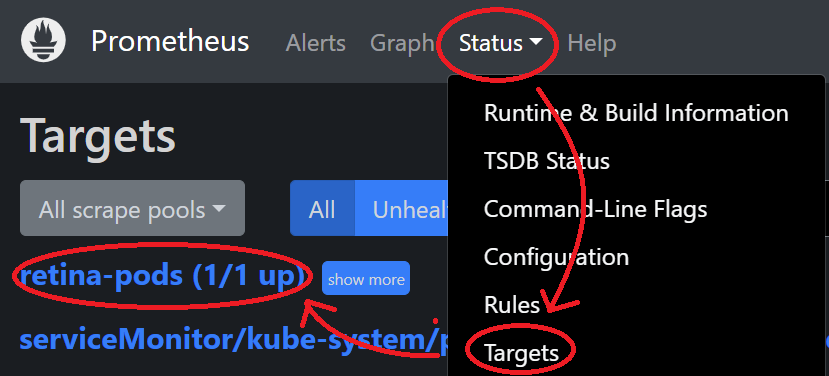
- Verify that the Retina Pods are being scraped by port-forwarding the Prometheus server:
kubectl port-forward --namespace kube-system svc/prometheus-operated 9090
- Then go to http://localhost:9090/targets to see the Retina Pods being discovered and scraped:
Configuring Grafana
Create a Grafana instance at grafana.com and follow Configuring Grafana, or use the one installed from above.
- Get the Grafana password:
kubectl get secret -n kube-system prometheus-grafana -o jsonpath="{.data.admin-password}" | base64 --decode ; echo
-
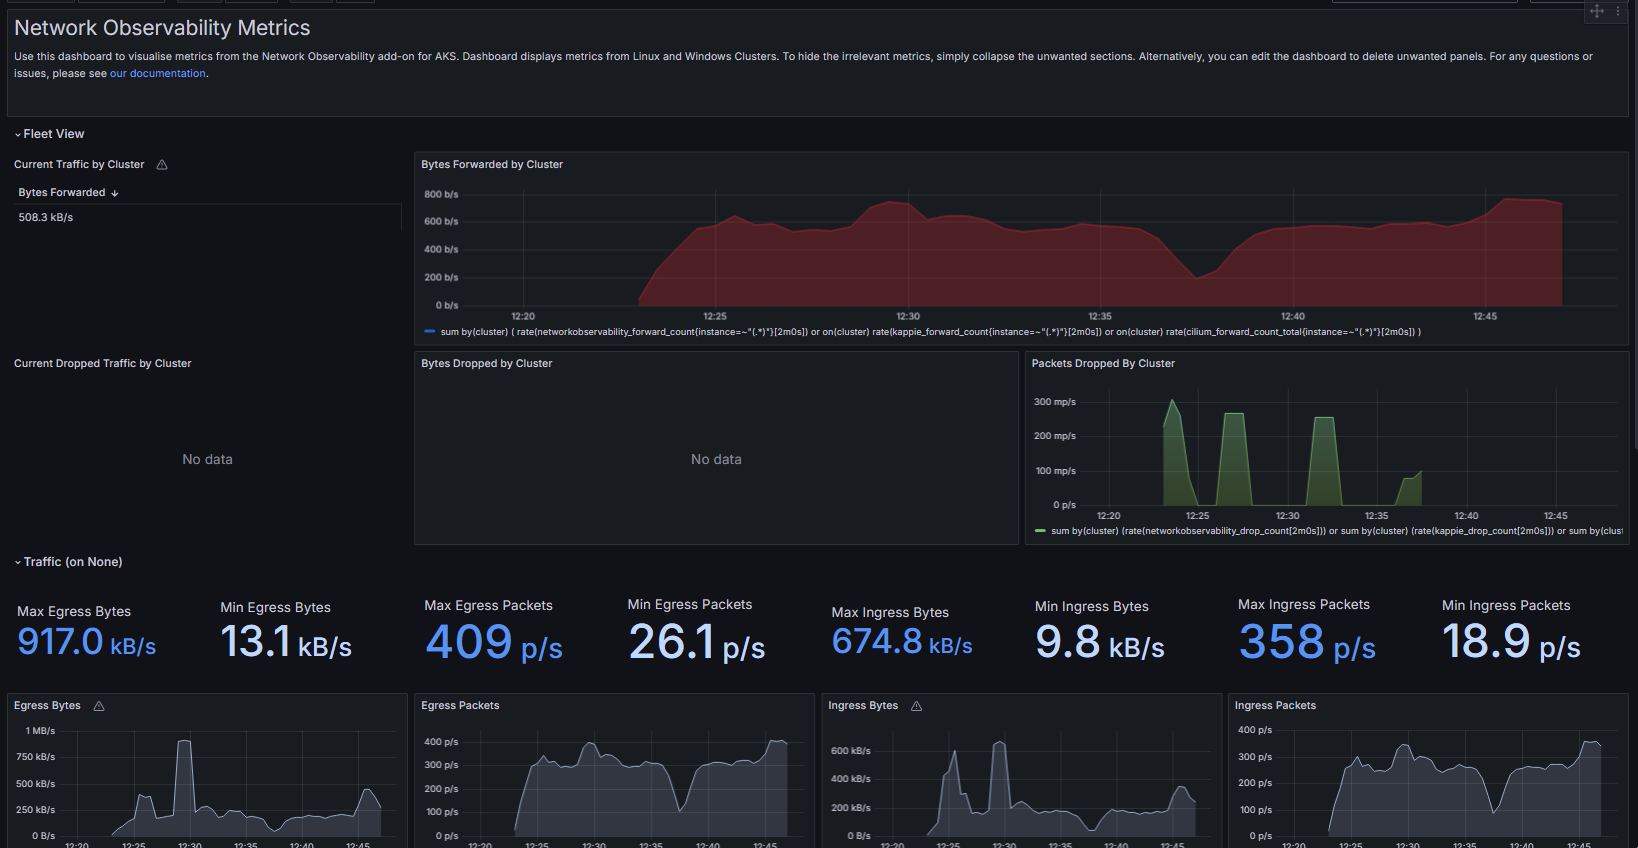
Import the new dashboard from here.
-
Metrics should be visible: