Architecture
Overview
In very simple terms, Retina collects metrics from the machine it's running on and hands them over to be processed and visualized elsewhere (in tools such as Prometheus, Hubble UI or Grafana).
To collect this data, Retina observes and hooks on to system events within the kernel through the use of custom eBPF plugins. The data gathered by the plugins is then transformed into flow objects (defined by Cilium) and enriched with Kubernetes context, before being converted to metrics and exported.
Data Plane
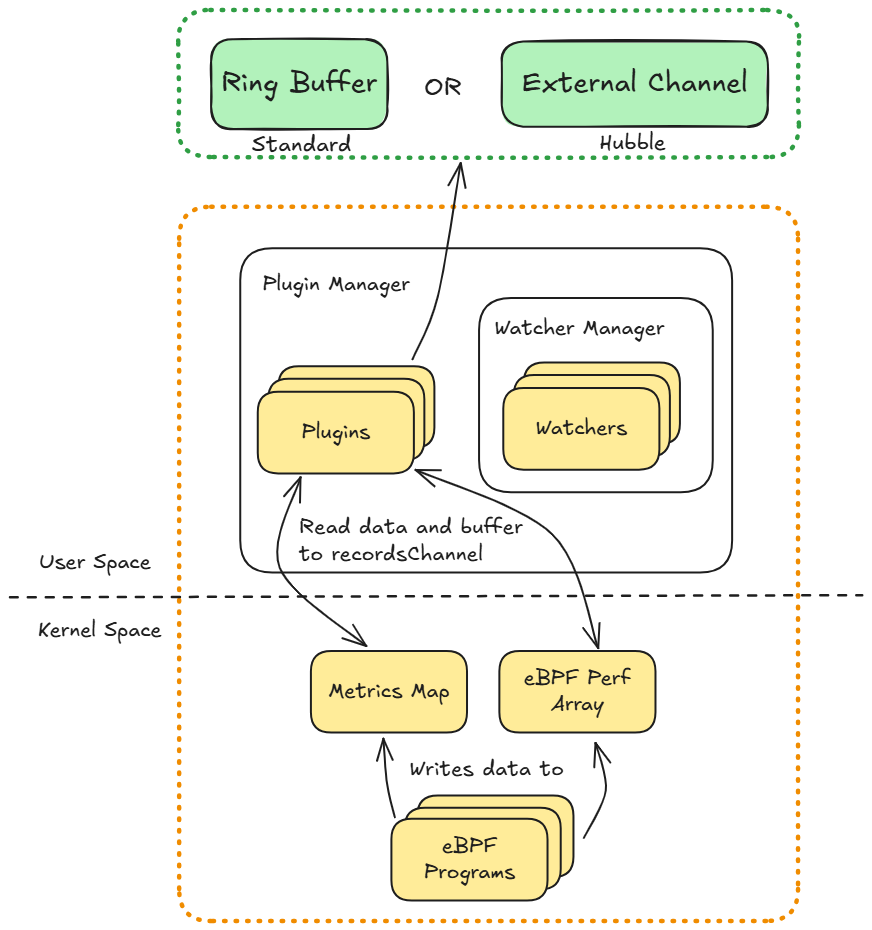
This section discusses how Retina collects its raw data. More specifically, it discusses how the eBPF programs and plugins are used.
The plugins have a very specific scope by design, and Retina is designed to be extendable, meaning it is easy to add in additional plugins if necessary. If there is a plugin missing for your use case, you can create your own! See our Development page for details on how to get started.
The plugins are responsible for installing the eBPF programs into the host kernel during startup. These eBPF programs collect metrics from events in the kernel level, which are then passed to the user space where they are parsed and converted into a flow data structure. Depending on the Control Plane being used, the data will either be sent to a Retina Enricher, or written to an external channel which is consumed by a Hubble observer - more on this in the Control Plane section below. It is not required for a plugin to use eBPF, it can also use syscalls or other API calls. In either case, the plugins will implement the same interface.
Data Transfer Mechanisms: eBPF programs transfer data from kernel to user space using specialized data structures. The packetparser plugin currently uses perf arrays (BPF_MAP_TYPE_PERF_EVENT_ARRAY), which create per-CPU buffers. Community users have reported performance considerations with this approach on high-core-count systems. See packetparser performance considerations for details.
Some examlpes of existing Retina plugins:
- Drop Reason - measures the number of packets/bytes dropped and the reason and the direction of the drop.
- DNS - counts DNS requests/responses by query, including error codes, response IPs, and other metadata.
- Packet Forward - measures packets and bytes passing through the eth0 interface of each node, along with the direction of the packets.
You can check out the rest on the Plugins page.

Plugin Lifecycle
The Plugin Manager is in charge of starting up all of the plugins. It can also reconcile plugins, which will regenerate the eBPF code and the BPF object.
The lifecycle of a plugins themselves can be summarized as follows:
- Initialize - Initialize eBPF maps. Create sockets / qdiscs / filters etc. Load eBPF programs.
- Start - Read data from eBPF maps and arrays. Send it to the appropriate location depending on the Control Plane.
- Stop - Clean up any resources created and stop any threads.
The Plugin Manager also starts up the Watcher Manager - which in turn starts the watchers.
The Endpoint Watcher periodically dumps out a list of veth interfaces corresponding to the pods, and then publishes an EndpointCreated or EndpointDeleted event depending on the lists current state compared to the last recorded state. These events are consumed by the Packet Parser and converted into flows.
The API Server Watcher resolves the hostname of the API server it is monitoring to a list of IP addresses. It then compares these addresses against a cache of IP addresses which it maintains and publishes a NewAPIServerObject event containing the new IPs if necessary. This information is added to the IP cache and used to enrich the flows.
Control Plane
This section describes how the collected data from the Data Plane is processed, transformed and used.
Retina currently has two options for the Control Plane:
| Platform | Supported Control Plane |
|---|---|
| Windows | Standard |
| Linux | Standard, Hubble |
Both Control Planes integrate with the same Data Plane, and have the same contract which is the flow data structure. Both Control Planes also generate metrics and traces, albeit different metrics are supported by each. See our Metrics page for more information.
Please refer to the Installation page for further setup instructions.
Hubble Control Plane
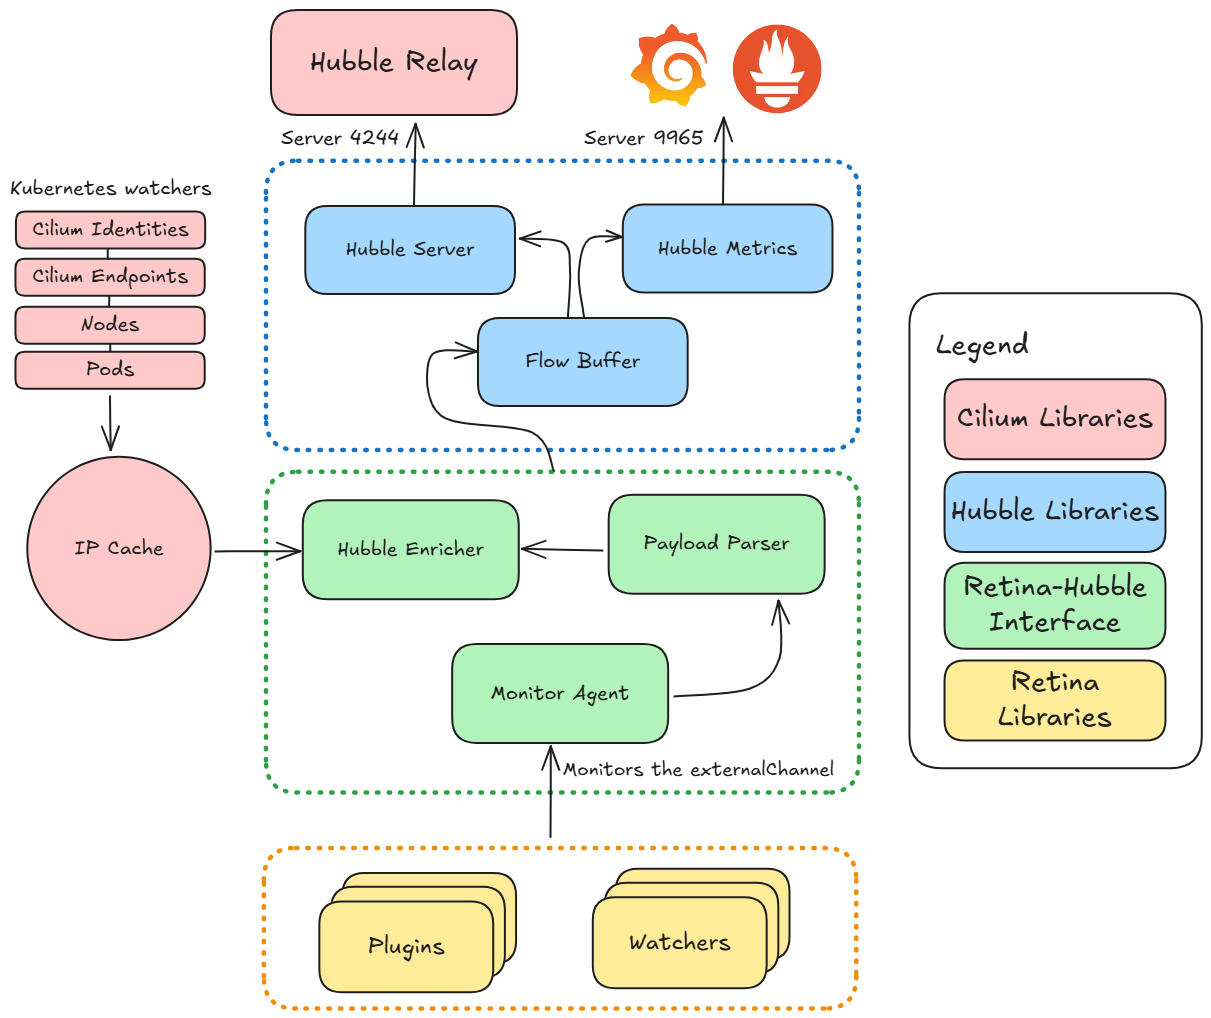
When the Hubble Control Plane is being used, the data from the plugins is written to an external channel. A component called the Monitor Agent monitors this channel, and keeps track of a list of listeners and consumers. One of such consumers is the Hubble Observer. This means that when the Monitor Agent detects an update in the channel it will forward the data to the Hubble Observer.
The Hubble Observer is configured with a list of parsers capable of interpreting different types of flow objects(L4, DNS, Drop). These are then enriched with Kubernetes specific context through the use of Cilium libraries (red blocks in the diagram). This includes mapping IP addressses to Kubernetes objects such as Nodes, Pods, Namespaces or Labels. This data comes from a cache that Retina maintains of Kubernetes metadata keyed to IPs.
Hubble uses the enriched flows to generate hubble_* metrics and flow logs, which are then served as follows:
- Server 9965 - Hubble metrics (Prometheus)
- Remote Server 4244 - Hubble Relay connects to this address to gleam flow logs for that node.
- Local Unix Socket
unix:///var/run/cilium/hubble.sock- serves node specific data

Standard Control Plane
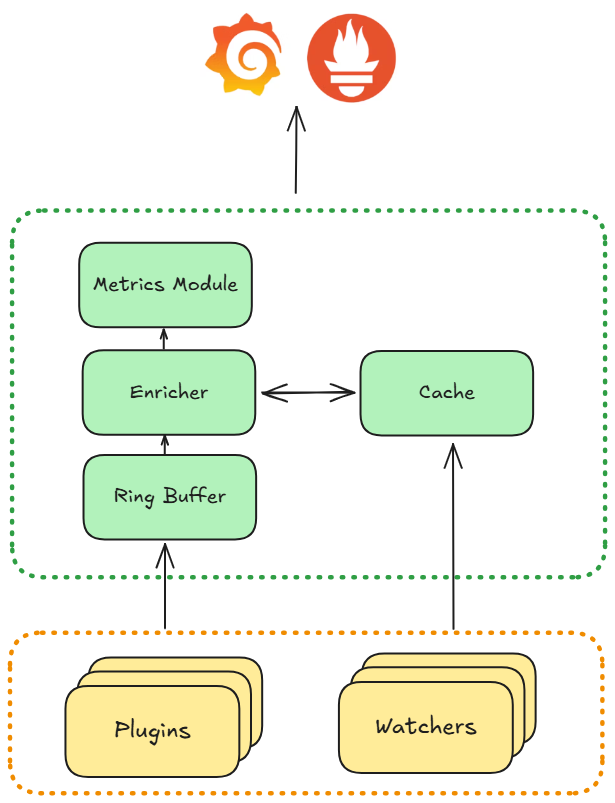
When the Standard Control Plane is being used, the data from the plugins is written to a custom Enricher component. This component is not initialized when using the Hubble Control Plane, and so the plugins know where to write the data to.
Retina maintains a cache of Kubernetes objects. The Enricher makes use of this cache to enrich the flow objects with this information. After enrichment, the flow objects are exported to an output ring.
The Metrics Module reads the data exported by the Enricher and constructs metrics out of it, which it then exports itself.
