Configuring Grafana
Grafana is an open-source platform for monitoring and observability. It allows you to query, visualize, alert on, and explore your metrics no matter where they are stored. For more information, visit the Grafana open-source section.
Pre-Requisites
Make sure that you're still port-forwarding your server to localhost:9090 as part of Prometheus setup. Alternatively you can configure your server for some other HTTP endpoint, but that is not covered in the following instructions.
Configuration
If you followed the steps to install and configure Prometheus, you will already have Grafana installed as part of the kube-prometheus-stack Helm chart.
-
Get Grafana user
kubectl get secret -n kube-system prometheus-grafana -o jsonpath="{.data.admin-user}" | base64 --decode ; echo -
Get Grafana password
kubectl get secret -n kube-system prometheus-grafana -o jsonpath="{.data.admin-password}" | base64 --decode ; echo -
Use port forwarding to access Grafana UI at localhost:8080 and enter you login credentials
kubectl port-forward --namespace kube-system svc/prometheus-grafana 8080:80
-
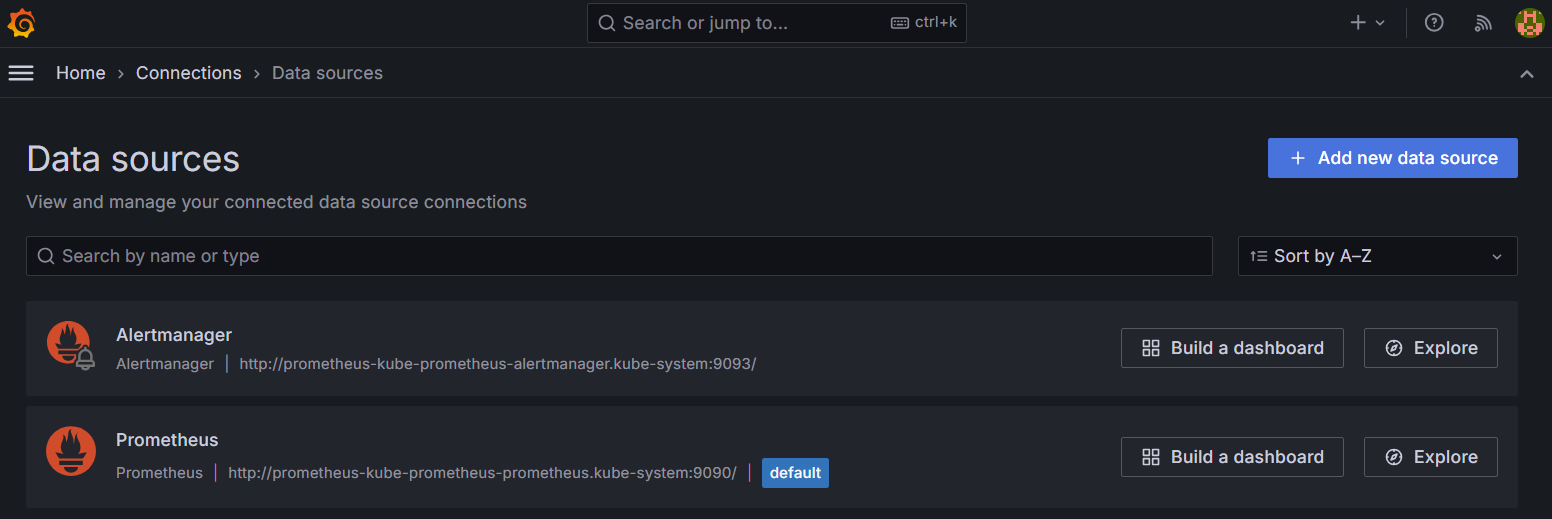
Make sure Prometheus is set as a default under Grafana datasources localhost:8080/connections/datasources
-
Import the kubernetes-networking-retina-cluster dashboard by id
22835at localhost:8080/dashboard/import. This dashboard is agnostic to the control plane used in Retina (Standard or Hubble).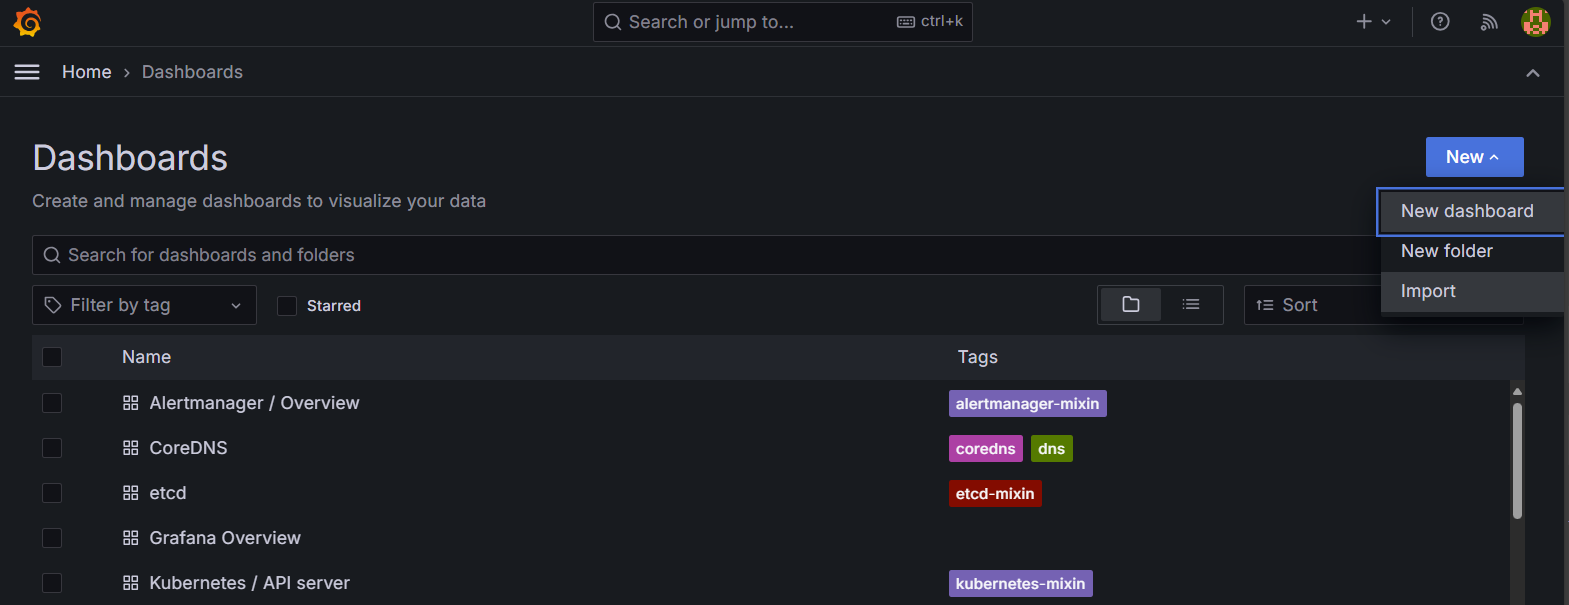
Some other available dashboards for Retina Standard are:
- kubernetes-networking-retina-standard-DNS dashboard (id
22836) - kubernetes-networking-retina-standard-PodTraffic dashboard (id
22837)
- kubernetes-networking-retina-standard-DNS dashboard (id
-
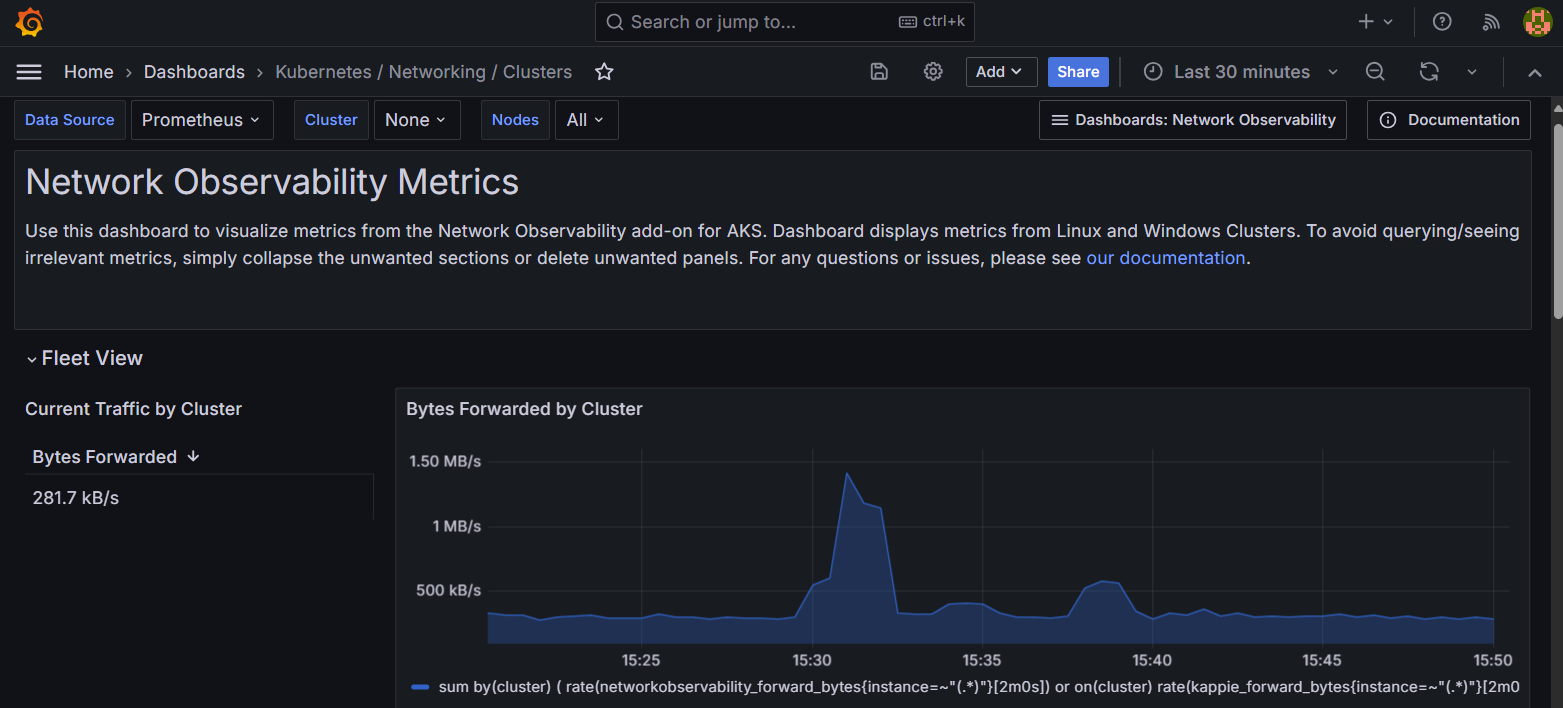
Kubernetes cluster metrics shouold be visible
Retina Dashboards
There is a set of Retina dashboards that you can import directly into Grafana as json files. The dashboards are found under deploy/grafana-dashboards/.
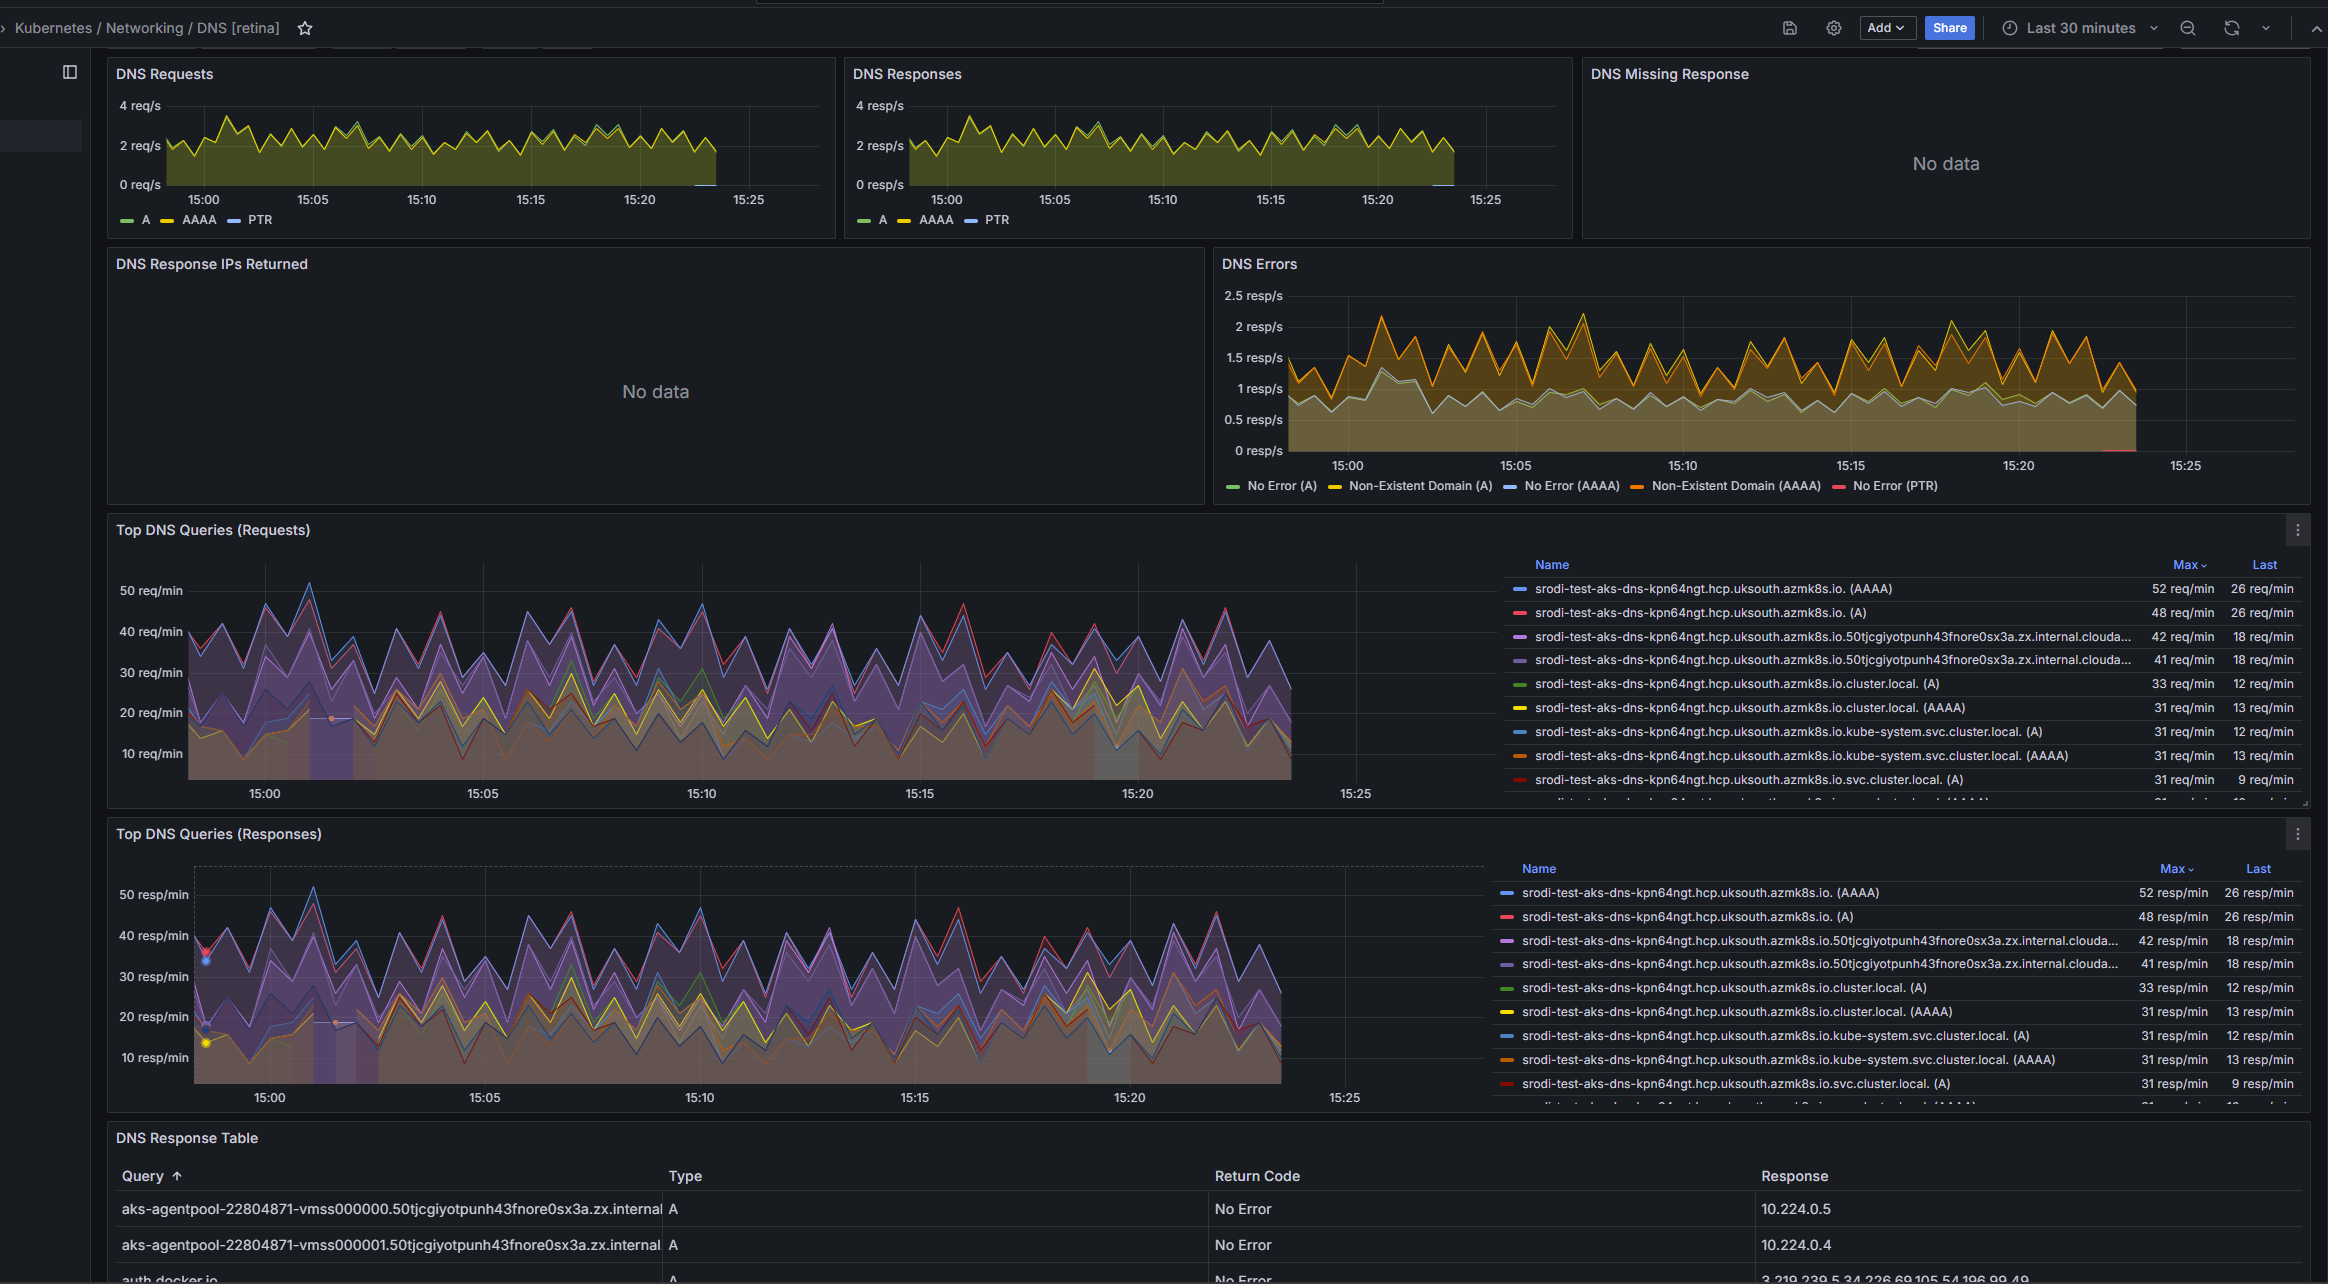
Here is an example of the Retina standard-dns.json dashboard.
These dashboards are also available at the Grafana Portal Retina Page