Configuring Prometheus
Prometheus is an open-source system monitoring and alerting toolkit originally built at SoundCloud. It is now a standalone open source project and maintained independently of any company. Prometheus's main features include a multi-dimensional data model, a flexible query language, efficient time series database, and modern alerting approach. For more information, visit the Prometheus website.
Pre-Requisites
- Create a Kubernetes cluster.
- Install Retina DaemonSet (see Quick Installation).
- Clone Retina Repository or download Prometheus Values File.
Install Prometheus via Helm
- In this example, we will install Prometheus via the community supported helm chart. If you already have this chart deployed, skip to step 3.
helm repo add prometheus-community https://prometheus-community.github.io/helm-charts
helm repo update
- Install the Prometheus chart
CONTROL_PLANE=hubble # or standard
# The value of VALUE_FILE_PATH is relative to the repo root folder. Update this according to the location of your file.
VALUE_FILE_PATH=deploy/${CONTROL_PLANE}/prometheus/values.yaml
helm install prometheus -n kube-system -f $VALUE_FILE_PATH prometheus-community/kube-prometheus-stack
Or if you already have the chart installed, upgrade how you see fit, providing the new job name as an additional scrape config, ex:
# The value of VALUE_FILE_PATH is relative to the repo root folder. Update this according to the location of your file.
VALUE_FILE_PATH=deploy/standard/prometheus/values.yaml
helm upgrade prometheus -n kube-system -f $VALUE_FILE_PATH prometheus-community/kube-prometheus-stack
Note: Grafana and kube-state metrics may schedule on Windows nodes, the current chart doesn't have node affinity for those components. Some manual intervention may be required.
Access Prometheus UI
- Use port forwarding to accees Prometheus UI:
kubectl port-forward --namespace kube-system svc/prometheus-operated 9090
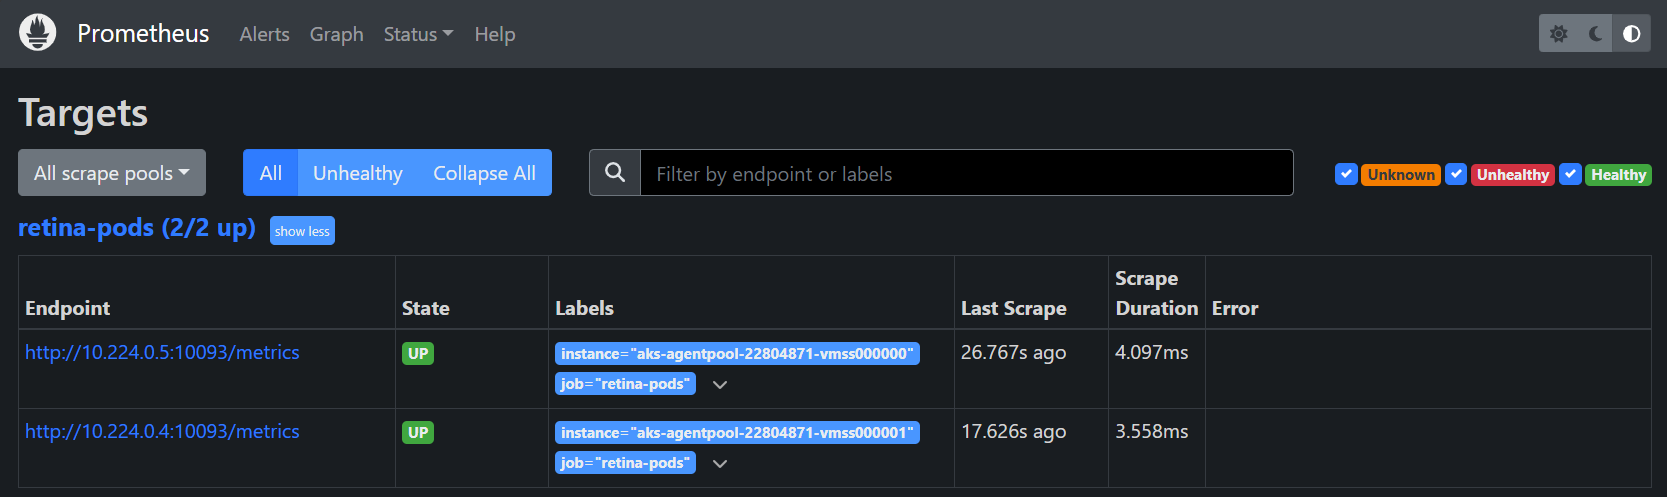
- Go to localhost:9090/targets to see the Retina Pods being discovered and scraped by Prometheus
Next steps
Follow Configuring Grafana to visualise metrics in dashboards.